Self-Hosting Setup & Pipeline
A NixOS home server with an automated deployment pipeline and Prometheus + Grafana monitoring of disk, NAS, CPU and memory.
- ROLE
- [Your role]
- TIMELINE
- [Start — End]
- STATUS
- LIVE
- TYPE
- INFRA · DEVOPS
- STACK
- NIXOS
- PROMETHEUS
- GRAFANA
01
The problem
[What problem did the self-hosting setup solve, for whom, and why did it matter? Two or three sentences.]
02
The approach
- 01[Key decision #1 — the architecture or approach you chose and why.]
- 02[Key decision #2 — a hard technical problem and how you solved it.]
- 03[Key decision #3 — how you shipped, measured or maintained it.]
03
Screenshots
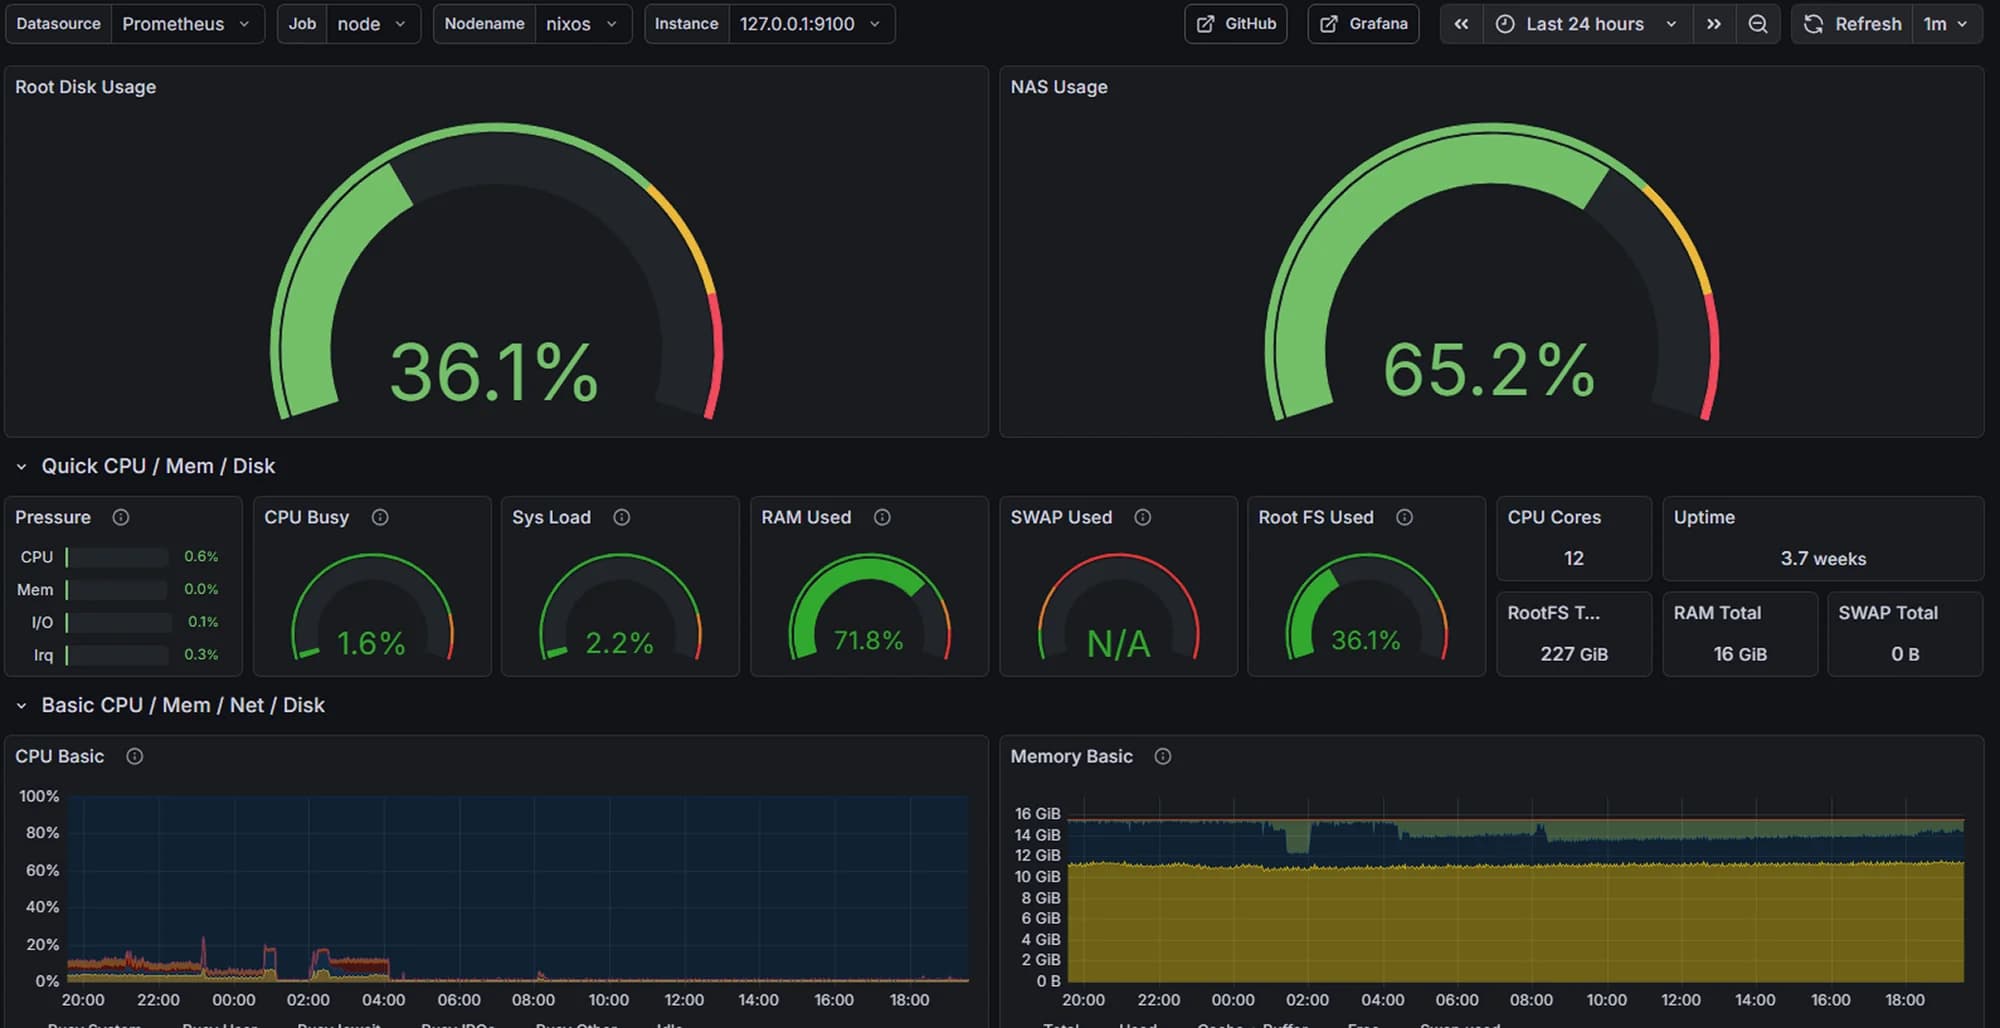
Grafana node dashboard — disk, NAS, CPU and memory
04
The outcome
[The result: what changed for users or the business. Use real numbers if you have them.]